Abstract
The study of causality in multivariate relationships in scientific studies involves the application of stochastic models in quantifying complex relationships. Stochastic models are becoming increasingly significant in health research due to their adaptability in practical situations and their ability to capture randomness, assess uncertainty, and inform decision-making. The models also provide reliable performance in capturing the complex determinants of malnutrition, demonstrating prediction precision and explanatory power. This study applies iterative parameter estimation methods for the multinomial regression model to investigate factors influencing childhood malnutrition in Kenya. Using data from the 2022 Kenya Demographic and Health Survey (KDHS), the research applies Newton-Raphson, Fisher’s Scoring, and Reweighted Least Squares methods to estimate parameters of the model and assess their classification performance. The study evaluates classification accuracy, goodness of fit, computational time, and predictive power of each method to identify the most reliable approach for modeling multinomial outcomes of childhood malnutrition, including stunting, wasting, underweight, and overweight. The methodological novelty of this study is the systematic comparison of iterative estimation methods, and the practical implications of selecting a method consistent with study objectives. By revealing causal relationships between malnutrition outcomes and significant demographic, socioeconomic, and environmental factors, the study aims to improve the analysis of multinomial datasets, provide accurate estimates, and support evidence-based decision-making for public health interventions in Kenya. The study results therefore, demonstrate practical policy implications for interventions toward high-risk children, prioritizing resource allocation and ensuring stronger credibility of evidence that supports nutritional policy decisions.
Keywords
Multinomial Regression, Newton-Raphson Method, Fisher’s Scoring Method, Reweighted Least Squares Method, Childhood Malnutrition, Evidence-based Decision-making, Public Health Interventions
1. Introduction
Stochastic models play a crucial role in quantifying causal relationships and support evidence-based decision making in multivariate health research
| [1] | Simons, E., Ferrari, M., Fricks, J., Wannemuehler, K., & Anand, A. (2012). Assessment of the 2010 global measles mortality reduction goal: Results from a model of surveillance data. The Lancet, 379(9832), 2173-2178. https://doi.org/10.1016/S0140-6736(12)60522-4 |
[1]
. For nominal outcomes with more than two unordered categories, the multinomial regression model generalizes binary logistic regression by modeling the log odds of each category as a linear function of predictors and estimating category probabilities using the logistic function
| [2] | Long, J. S. (2012). Regression models for nominal and ordinal outcomes. In J. Best & W. Wolf (Eds.), Regression models (pp. 45-73). Thousand Oaks, CA: Sage Publications. https://doi.org/10.4135/9781446288146.n9 |
[2]
. Estimation of the model parameters requires solving non-linear maximum likelihood equations. Practitioners typically rely on iterative numerical methods to obtain consistent and asymptotically normal parameter estimates and reliable inference.
Childhood malnutrition remains a major public health concern worldwide, particularly in developing countries where both undernutrition and overnutrition coexist. In Kenya, recent estimates from the 2022 Kenya Demographic and Health Survey (KDHS) reported 17.6% of children under five were stunted, 4.9% wasted, 10.1% underweight, and 3.2% overweight
. These statistics highlight a two-fold challenge, as malnutrition negatively impacts children’s physical and cognitive development, weakens immunity, and contributes to higher morbidity and mortality
| [4] | Etim, K. D. (2016). Nutritional status of children under five years in Ekureku community, Abi L. G. A. of Cross River State, Nigeria (Master’s thesis, University of Calabar, Nigeria). https://doi.org/10.7537/marsnys130320.07 |
[4]
. Addressing childhood malnutrition is therefore critical in achieving sustainable child health outcomes and meeting the Sustainable Development Goals (SDGs) 2030
.
There are limited studies that explicitly compare Newton-Raphson, Fisher’s Scoring, and Reweighted Least Squares methods in the context of multinomial regression for childhood malnutrition data, both undernutrition and overnutrition. Different optimization methods can produce significantly different coefficient estimates, standard errors, and classification results, which may lead to poor model performance or biased inference. This study applies and compares Newton-Raphson, Fisher’s Scoring, and Reweighted Least Squares methods on KDHS (2022) data with the aims of identifying significant factors, fitting a reliable multinomial regression model, and evaluating each method’s predictive performance.
Evaluating estimation methods for multinomial regression is important both methodologically because multinomial regression maintain information across outcome categories and can reduce standard errors for parameter estimates
, and practically aims to (a) identify significant factors influencing childhood malnutrition in Kenya, (b) fit a reliable multinomial regression model for prediction, and (c) determine which estimation method attains the best combination of unbiased parameter estimates, predictive accuracy and computational efficiency. This study aims to inform researchers and policy-makers targeting child nutrition interventions.
2. Literature Review
Previous research has applied statistical models, particularly multinomial regression, to investigate determinants of child health outcomes, and more recent studies confirm its usefulness in analyzing child nutrition and health
| [7] | Getacher, L., Ademe, B. W., & Belachew, T. (2023). Double burden of malnutrition and its associated factors among adolescents in Debre Berhan Regiopolitan City, Ethiopia: a multinomial regression model analysis. Frontiers in Nutrition, 10, 1187875. https://doi.org/10.3389/fnut.2023.1187875 |
[7]
. Multinomial regression is effective in analyzing multiple outcome categories simultaneously without collapsing them into binary outcomes, thereby yielding more precise estimates
.
| [8] | Abdalla, E.-h. (2012). An application of the multinomial logistic regression model. Pakistan Journal of Statistics and Operation Research, 8(2), 271-291. https://doi.org/10.18187/pjsor.v8i2.244 |
[8]
applied multinomial regression to study physical violence against children, while
| [9] | Mukesi, M., Phillips, I. N., Moyo, S. R., & Mtambo, O. P. L. (2017). Prevalence of skin allergies in adolescents in Namibia. International Journal of Allergy Medications, 3(1), 22. https://doi.org/10.23937/2572-3308.1510022 |
[9]
and
| [10] | Ranciere, F., Nikasinovic, L., & Momas, I. (2013). Dry night cough as a marker of allergy in preschool children: The PARIS birth cohort. Pediatric Allergy and Immunology, 24(2), 131-137. https://doi.org/10.1111/pai.12042 |
[10]
used it to explore allergic morbidity and respiratory outcomes. In the context of nutrition, studies have shown that factors such as maternal education, household wealth, and place of residence significantly influence nutritional outcomes among children
| [11] | Bbaale, E. (2014). Maternal education and child nutritional status: Evidence from Uganda. African Journal of Economic and Management Studies, 5(1), 52-74. https://doi.org/10.1108/AJEMS-06-2012-0040 |
| [12] | Katoch, O. R. (2022). Determinants of malnutrition among children: A systematic review. Nutrition, 96, 111565. https://doi.org/10.1016/j.nut.2021.111565 |
| [13] | Heltberg, R. (2009). Malnutrition, poverty, and economic growth. Health Economics, 18(S1), S77-S88. https://doi.org/10.1002/hec.1462 |
| [14] | Agho, K. E., Akombi, B. J., Ferdous, A. J., Mbugua, I., & Kamara, J. K. (2019). Childhood undernutrition in three disadvantaged East African Districts: a multinomial analysis. BMC Pediatrics, 19, 118. https://doi.org/10.1186/s12887-019-1482-y |
[11-14]
. However, despite its increasing application, limited studies have compared iterative estimation methods used to fit multinomial regression models in health research
| [15] | Li, L., Rysavy, M. A., Bobashev, G., & Das, A. (2024). Comparing methods for risk prediction of multicategory outcomes: dichotomized logistic regression vs. multinomial logit regression. BMC Medical Research Methodology, 24, Article 261. https://doi.org/10.1186/s12874-024-02389-x |
[15]
.
A major challenge in multinomial regression is that the model parameters are estimated using iterative maximum likelihood methods, and different methods may produce varying estimates, classification accuracies, and computational times. Newton-Raphson, Fisher’s Scoring, and Reweighted Least Squares methods are among the most widely used approaches to solving maximum likelihood equations for nonlinear models
| [16] | Czepiel, S. A. (2012). Maximum likelihood estimation of logistic regression models: Theory and implementation. Retrieved from http://czep.net/stat/mlelr.pdf |
| [17] | Zhang, T. (2021). Iteratively reweighted least squares with random effects for maximum likelihood in generalized linear mixed effects models. Journal of Statistical Computation and Simulation. https://doi.org/10.1080/00949655.2021.1928127 |
[16, 17]
. While each method has theoretical advantages, little is known about how they compare in practice when applied to complex health datasets such as childhood malnutrition. This raises concerns about the reliability and interpretability of results, which can influence evidence-based decision-making in nutrition policy.
This study addresses the gap by applying and comparing Newton-Raphson, Fisher’s Scoring, and Reweighted Least Squares methods to the KDHS 2022 dataset of children under the age of five years. The methods are evaluated based on classification accuracy, area under the curve (AUC), and computational time efficiency. By precisely assessing the performance of these estimation methods, the study provides insights into the most reliable approach for analyzing multinomial health outcomes. The findings contribute both to methodological knowledge in biostatistics and to practical policy-making in child health and nutrition in Kenya and similar contexts.
3. Methodology
3.1. Model Fitting
Multinomial regression model: Multinomial regression model fits the log odds of outcome categories as a linear function of predictors.
Given is the outcome variable with nominal categories such that and are predictors such that , then the multinomial regression model relative to baseline categorical outcome J is expressed as:
where
Odds: Odds represent the ratio of the likelihood of being in the categorical outcome over the probability of being in the baseline categorical outcome modeled as a function of predictor variables given as the exponential value of log-odds in the Multinomial Regression model.
3.2. Significance Testing
Wald statistic: Wald statistic partially evaluates the importance of each parameter to establish the reliability of each predictor variable in fitting a model in the classification problem.
The null hypothesis is rejected if
or
.
Likelihood Ratio Tests: The Likelihood Ratio (LR) establishes whether the multinomial regression model is suitable by evaluating predictor variables that influence the fitting of the model simultaneously.
The null hypothesis is rejected if
or
.
3.3. Goodness of Fit
Pearson’s chi-squared statistic: Goodness of fit was examined by comparing observed and expected occurrences of outcome variables. Decision rules followed Pearson’s chi-squared statistic or p-value thresholds.
There is no major difference between anticipated and actual occurrences if the calculated chi-square statistic is lower than the .
McFadden’s adjusted pseudo-R2: Explanatory power was summarized using McFadden’s adjusted pseudo-R2, comparing the fitted model to an intercept-only model.
Larger values indicate a better fit.
3.4. Estimation Methods
Newton Raphson Method (NR): An iterative parameter estimation method which updates using gradient and observed information (Hessian) such that;
The method converges such that , where is a negligible positive real number.
Fisher’s Scoring Method (FS): An alternate iterative method of parameter estimation using the expected information matrix (Expectation Value of the Hessian matrix) such that;
The method converges such that , where is a negligible positive real number.
Reweighted Least Squares method: Reweighted Least Squares method is an iterative estimation which computes working responses (zi) and weights (wi) at each iteration (v) to weighted least squares updates such that;
=
=
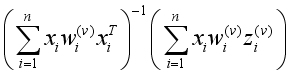
In the reweighted least squares method, step-halving results in convergence.
3.5. Diagnostic and Model Evaluation Tests
Multicollinearity: Multicollinearity was detected using the Variance Inflation Factors (VIF) value.
If the value is greater than 10, then there is multicollinearity.
Confusion matrix: The confusion matrix was used to evaluate classification accuracy.
Area under the curve: Area under the curve was used to evaluate the performance of the model, with higher values indicating better performance.
Computational time: computational time was used to determine the time taken to fit the model.
4. Results and Discussion
4.1. Characteristics of the Study Population
The study sample consisted of 15,336 children under the age of five years derived from the 2022 Kenya Demographic and Health Survey (KDHS). Among these, 64.3% were classified as having normal weight, while 35.7% were malnourished. Specifically, 17.4% were stunted, 4.9% wasted, 10.0% underweight, and 3.4% overweight (
Table 1). These results reflect the continuing double burden of childhood malnutrition in Kenya, having both undernutrition and overnutrition.
Table 1. Distribution of nutritional status among children under five (KDHS 2022, n=15,336).
Nutritional Status | Percentage (%) of Children |
Normal | 64.3 |
Stunted | 17.4 |
Wasted | 4.9 |
Underweight | 10.0 |
Overweight | 3.4 |
Gender analysis revealed that 57.2% of stunted children and 55.6% of underweight children were male, whereas 54.5% of overweight children were female. Wealth index patterns revealed that stunting and underweight were most prevalent among children from the poorest households (37.0% and 44.0% respectively), while overweight was more common among children from the richest households (28.6%). These findings are consistent with the literature linking childhood malnutrition to socioeconomic inequalities
.
4.2. Significance Tests of Predictors
Likelihood Ratio (LR) tests identified several significant predictors of childhood malnutrition; region of residence (V024), type of residence (rural/urban) (V025), highest maternal education level (V106), number of under-five children in the household (V137), household wealth index (V190), gender of child (B4), and age of child (HW1). In contrast, diarrhea episodes, source of drinking water, toilet facility, and roofing material were not statistically significant.
Variance Inflation Factor (VIF) analysis confirmed no multicollinearity problems among the significant predictors (all VIF < 10).
Table 2. Summary of significant predictors of childhood malnutrition (Likelihood Ratio Tests).
Predictor | Significance (p-value) |
Region of residence | <0.001 |
Urban/rural residence | <0.01 |
Maternal education | <0.001 |
No. of under-five children | <0.05 |
Wealth Index | <0.001 |
Sex of child | <0.05 |
Age in months | <0.001 |
Diarrhea episode | Not significant |
Water source | Not significant |
Toilet facility | Not significant |
Roofing material | Not significant |
4.3. Multinomial Regression Model Estimation by Iterative Methods
Newton-Raphson method: using the Newton-Raphson (NR) approach (implemented in SPSS NOMREG), the full model demonstrated a significantly better fit than the intercept-only model (). Goodness of fit statistics indicated an adequate fit, with a non-significant Pearson and Deviance tests (). McFadden’s pseudo R2 was 0.109, indicating that 10.9% of the variance in childhood malnutrition outcomes was explained by the predictors.
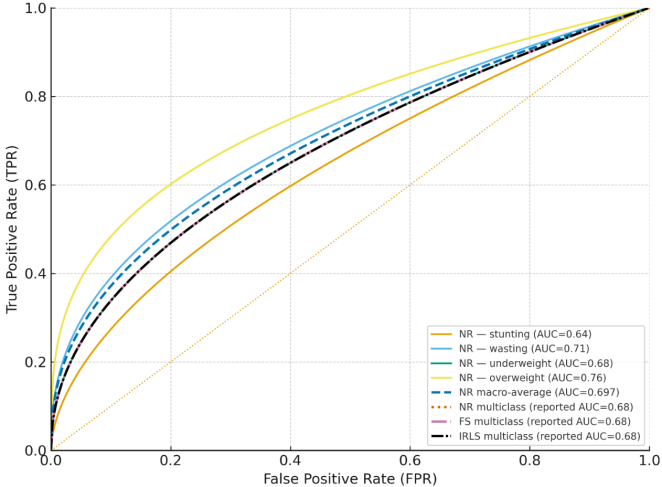
Discrimination ability was moderate: AUC values were 0.64 for stunting, 0.71 for wasting, 0.68 for underweight, and 0.76 for overweight, with a multiclass AUC of 0.68. The overall classification accuracy was 73.5%, though accuracy varied by nutritional outcome. The observed computational time was 2.50 seconds.
Fisher’s Scoring method: Fisher’s Scoring (FS) approach (implemented in nnet::multinom function in R software) also produced a significantly improved model fit (). Fit measures were strong, with Pearson and Deviance tests (). McFadden’s pseudo-R2 was 0.057, notably lower than NR.
Despite the lower pseudo-R2, AUC values were almost similar to those produced by NR, and the multiclass AUC was 0.68. Classification accuracy was 73.15%. A major strength of FS was efficiency: convergence required only 1.27 seconds.
Reweighted Least Squares method: Iteratively Reweighted Least Squares (IRLS) method (implemented in VGAM::vglm function in R software) yielded almost similar results to FS, with (), McFadden’s pseudo-R2 = 0.057, and multiclass AUC =0.68. Classification accuracy was also 73.15%. However, IRLS required 3.24 seconds for convergence.
4.4. Comparative Performance of Estimation Methods
NR produced the highest explanatory power (10.9%) and slightly superior classification (73.5%), while FS provided the fastest convergence. IRLS is computationally the slowest (3.24 seconds) but comparable in performance to FS (73.15%).
Table 3. Comparative performance of Newton-Raphson, Fisher’s Scoring, and IRLS methods.
Metric | Newton-Raphson | Fisher’s Scoring | IRLS |
Pseudo-R2 (McFadden) | 0.109 | 0.057 | 0.057 |
Classification Accuracy | 73.5% | 73.15% | 73.15% |
Multiclass AUC | 0.68 | 0.68 | 0.68 |
Computation time (sec) | 2.50 | 1.27 | 3.24 |
The overall Multiclass AUC (0.68) is moderate and the same for all methods; however, the per-class AUCs show significant differences; overweight (0.76) is much easier to identify than stunting (0.64).
Figure 1. Area Under the Curve (AUC) Comparative performance of Newton-Raphson, Fisher’s Scoring, and IRLS methods.
4.5. Specification of the Best Multinomial Regression Models
Multinomial regression models obtained from the data using the Newton-Raphson parameter estimation method are as follows:
The Newton-Raphson method provided the most accurate classification and the highest pseudo-R
2, confirming the theoretical expectation that NR leverages observed information to yield more precise parameter estimates
| [16] | Czepiel, S. A. (2012). Maximum likelihood estimation of logistic regression models: Theory and implementation. Retrieved from http://czep.net/stat/mlelr.pdf |
[16]
. However, FS and IRLS produced almost similar predictive performance with much faster convergence, demonstrating their practical advantage in computational time efficiency or complex datasets applications where efficiency is critical
| [17] | Zhang, T. (2021). Iteratively reweighted least squares with random effects for maximum likelihood in generalized linear mixed effects models. Journal of Statistical Computation and Simulation. https://doi.org/10.1080/00949655.2021.1928127 |
[17]
. FS may be preferred, however, for health research where the most accurate classification is required, NR appears superior.
Factors such as maternal education, wealth index, urban/rural residence, and child’s age emerged as consistent determinants of childhood malnutrition. These findings align with studies from other African countries
| [11] | Bbaale, E. (2014). Maternal education and child nutritional status: Evidence from Uganda. African Journal of Economic and Management Studies, 5(1), 52-74. https://doi.org/10.1108/AJEMS-06-2012-0040 |
| [18] | Kandala, N. B., Madungu, T. P., Emina, J. B., Nzita, K. P., & Cappuccio, F. P. (2011). Malnutrition among children under the age of five in the Democratic Republic of Congo (DRC): Does geographic location matter? BMC Public Health, 11(1), 261. https://doi.org/10.1186/1471-2458-11-261 |
[11, 18]
which emphasize socioeconomic inequalities as the major result of both undernutrition and overnutrition. Wealth trend observed from this study suggests Kenya is undergoing a nutritional transition, where wealthier households are increasingly exposed to overweight and obesity among children, while poorer households continue to suffer from stunting and underweight
.
While all the estimation methods converged to stable solutions, their performance varied, highlighting the importance of selecting appropriate estimation methods for multinomial regression in public health applications. Newton-Raphson appears to offer the best choice of model fit and classification accuracy, making it a valuable tool for analyzing complex health datasets such as childhood malnutrition.
5. Conclusions and Recommendations
5.1. Summary
The study applied Newton-Raphson, Fisher’s Scoring, and Iteratively Reweighted Least Squares methods to a multinomial regression model of childhood malnutrition in Kenya. While all methods achieved convergence and comparable AUC values, Newton-Raphson demonstrated superior classification accuracy and explanatory power, whereas Fisher’s Scoring was the fastest computationally. The analysis identified region of residence, type of residence (urban/rural), maternal education, number of under-five children in the household, household wealth index, child’s gender, and child’s age as significant factors influencing childhood malnutrition in Kenya.
5.2. Conclusions
The Newton-Raphson method appears most appropriate when the main research objective is classification accuracy, especially in health policy applications where predictive precision is critical. Fisher’s Scoring method, however, may be the preferred choice for research applications involving very large datasets or constrained computing resources, given its efficiency. The results confirm that multinomial regression is an effective model for analyzing nominal health outcomes, providing reliable performance in capturing the complex determinants of malnutrition.
The methodological novelty of this study is a systematic comparison of iterative estimation methods in a large-scale national health survey, demonstrating how the methods affect predictive precision, explanatory power, computational efficiency, classification outcomes, and inferences. The study highlights the practical implications of aligning the method with study objectives; maximizing predictive accuracy in health policy evaluations or favoring computational efficiency in very large datasets, explicitly documenting the method and package used for reproducibility and robustness of the results, and conducting sensitivity checks in complex survey features and variance estimation.
The public health implications of the analysis are evident; approximately 36% of Kenyan children under the age of five remain malnourished, with determinants mainly being maternal education, socioeconomic status, and regional disparities. Addressing these inequalities is vital for achieving national and global nutritional goals.
From a policy evaluation, the results confirm that childhood malnutrition in Kenya remains propelled by child age, regional disparities, household wealth, and maternal education. Addressing these factors aims at reducing stunting and underweight in poorer households, and preventive measures against overweight in wealthier households. The study demonstrates practical policy implications for targeting and identification of high-risk children, cost-effective programs, standardizing analytical procedures, adopting routine sensitive analysis, and training analysts in numerical diagnostics and statistical uncertainties. This will strengthen the credibility of evidence that informs resource allocation priorities, transparent reporting of methods, and validation in nutritional policy analyses.
5.3. Recommendations
Prioritize evidence-based policies and targeted interventions to address socioeconomic and educational determinants of childhood malnutrition.
Reduce missing information in national survey data to strengthen predictive modeling.
Researchers should adopt the Newton-Raphson method for maximum accuracy, but consider Fisher’s Scoring method in very large and complex datasets or resource-constrained contexts.
Future research should explore alternative models to improve prediction and incorporate unobserved determinants.
Abbreviations
AUC | Area Under the Curve |
FS | Fisher’s Scoring |
IRLS | Iteratively Reweighted Least Squares |
KDHS | Kenya Demographic and Health Survey |
LR | Likelihood Ratio |
NR | Newton-Raphson |
SDGs | Sustainable Development Goals |
VIF | Variance Inflation Factor |
Author Contributions
Paul Mwangi Kariuki: Conceptualization, Data curation, Formal Analysis, Investigation, Methodology, Project administration, Resources, Software, Visualization, Writing - original draft
James Mwangi Kahiri: Supervision, Validation, Writing - review & editing
Conflicts of Interest
The authors declare no conflict of interest.
References
| [1] |
Simons, E., Ferrari, M., Fricks, J., Wannemuehler, K., & Anand, A. (2012). Assessment of the 2010 global measles mortality reduction goal: Results from a model of surveillance data. The Lancet, 379(9832), 2173-2178.
https://doi.org/10.1016/S0140-6736(12)60522-4
|
| [2] |
Long, J. S. (2012). Regression models for nominal and ordinal outcomes. In J. Best & W. Wolf (Eds.), Regression models (pp. 45-73). Thousand Oaks, CA: Sage Publications.
https://doi.org/10.4135/9781446288146.n9
|
| [3] |
KNBS and ICF. 2023. Kenya Demographic and Health Survey 2022. Nairobi, Kenya, and Rockville, Maryland, USA: KNBS and ICF.
https://www.knbs.or.ke/wp-content/uploads/2023/08/Kenya-Demographic-and-Health-Survey-KDHS-2022-Summary-Report.pdf
|
| [4] |
Etim, K. D. (2016). Nutritional status of children under five years in Ekureku community, Abi L. G. A. of Cross River State, Nigeria (Master’s thesis, University of Calabar, Nigeria).
https://doi.org/10.7537/marsnys130320.07
|
| [5] |
UNICEF, (2015). UNICEF’s approach to scaling up nutrition for mothers and their children.
https://www.unicef.org/media/49686/file/2015ARR_Nutrition.pdf
|
| [6] |
Kwak, C., & Clayton, M. A. (2002). Multinomial logistic regression. Nursing Research, 51(6), 404-410.
https://doi.org/10.1097/00006199-200211000-00009
|
| [7] |
Getacher, L., Ademe, B. W., & Belachew, T. (2023). Double burden of malnutrition and its associated factors among adolescents in Debre Berhan Regiopolitan City, Ethiopia: a multinomial regression model analysis. Frontiers in Nutrition, 10, 1187875.
https://doi.org/10.3389/fnut.2023.1187875
|
| [8] |
Abdalla, E.-h. (2012). An application of the multinomial logistic regression model. Pakistan Journal of Statistics and Operation Research, 8(2), 271-291.
https://doi.org/10.18187/pjsor.v8i2.244
|
| [9] |
Mukesi, M., Phillips, I. N., Moyo, S. R., & Mtambo, O. P. L. (2017). Prevalence of skin allergies in adolescents in Namibia. International Journal of Allergy Medications, 3(1), 22.
https://doi.org/10.23937/2572-3308.1510022
|
| [10] |
Ranciere, F., Nikasinovic, L., & Momas, I. (2013). Dry night cough as a marker of allergy in preschool children: The PARIS birth cohort. Pediatric Allergy and Immunology, 24(2), 131-137.
https://doi.org/10.1111/pai.12042
|
| [11] |
Bbaale, E. (2014). Maternal education and child nutritional status: Evidence from Uganda. African Journal of Economic and Management Studies, 5(1), 52-74.
https://doi.org/10.1108/AJEMS-06-2012-0040
|
| [12] |
Katoch, O. R. (2022). Determinants of malnutrition among children: A systematic review. Nutrition, 96, 111565.
https://doi.org/10.1016/j.nut.2021.111565
|
| [13] |
Heltberg, R. (2009). Malnutrition, poverty, and economic growth. Health Economics, 18(S1), S77-S88.
https://doi.org/10.1002/hec.1462
|
| [14] |
Agho, K. E., Akombi, B. J., Ferdous, A. J., Mbugua, I., & Kamara, J. K. (2019). Childhood undernutrition in three disadvantaged East African Districts: a multinomial analysis. BMC Pediatrics, 19, 118.
https://doi.org/10.1186/s12887-019-1482-y
|
| [15] |
Li, L., Rysavy, M. A., Bobashev, G., & Das, A. (2024). Comparing methods for risk prediction of multicategory outcomes: dichotomized logistic regression vs. multinomial logit regression. BMC Medical Research Methodology, 24, Article 261.
https://doi.org/10.1186/s12874-024-02389-x
|
| [16] |
Czepiel, S. A. (2012). Maximum likelihood estimation of logistic regression models: Theory and implementation. Retrieved from
http://czep.net/stat/mlelr.pdf
|
| [17] |
Zhang, T. (2021). Iteratively reweighted least squares with random effects for maximum likelihood in generalized linear mixed effects models. Journal of Statistical Computation and Simulation.
https://doi.org/10.1080/00949655.2021.1928127
|
| [18] |
Kandala, N. B., Madungu, T. P., Emina, J. B., Nzita, K. P., & Cappuccio, F. P. (2011). Malnutrition among children under the age of five in the Democratic Republic of Congo (DRC): Does geographic location matter? BMC Public Health, 11(1), 261.
https://doi.org/10.1186/1471-2458-11-261
|
Cite This Article
-
APA Style
Kariuki, P. M., Kahiri, J. M. (2025). Application of Newton Raphson, Fisher’s Scoring, and Reweighted Least Squares Methods for Multinomial Regression in Investigating Childhood Malnutrition in Kenya. American Journal of Theoretical and Applied Statistics, 14(5), 203-210. https://doi.org/10.11648/j.ajtas.20251405.11
 Copy
|
Copy
|
 Download
ACS Style
Kariuki, P. M.; Kahiri, J. M. Application of Newton Raphson, Fisher’s Scoring, and Reweighted Least Squares Methods for Multinomial Regression in Investigating Childhood Malnutrition in Kenya. Am. J. Theor. Appl. Stat. 2025, 14(5), 203-210. doi: 10.11648/j.ajtas.20251405.11
Copy
|
Download
AMA Style
Kariuki PM, Kahiri JM. Application of Newton Raphson, Fisher’s Scoring, and Reweighted Least Squares Methods for Multinomial Regression in Investigating Childhood Malnutrition in Kenya. Am J Theor Appl Stat. 2025;14(5):203-210. doi: 10.11648/j.ajtas.20251405.11
Copy
|
Download
-
@article{10.11648/j.ajtas.20251405.11,
  author = {Paul Mwangi Kariuki and James Mwangi Kahiri},
  title = {Application of Newton Raphson, Fisher’s Scoring, and Reweighted Least Squares Methods for Multinomial Regression in Investigating Childhood Malnutrition in Kenya
},
  journal = {American Journal of Theoretical and Applied Statistics},
  volume = {14},
  number = {5},
  pages = {203-210},
  doi = {10.11648/j.ajtas.20251405.11},
  url = {https://doi.org/10.11648/j.ajtas.20251405.11},
  eprint = {https://article.sciencepublishinggroup.com/pdf/10.11648.j.ajtas.20251405.11},
  abstract = {The study of causality in multivariate relationships in scientific studies involves the application of stochastic models in quantifying complex relationships. Stochastic models are becoming increasingly significant in health research due to their adaptability in practical situations and their ability to capture randomness, assess uncertainty, and inform decision-making. The models also provide reliable performance in capturing the complex determinants of malnutrition, demonstrating prediction precision and explanatory power. This study applies iterative parameter estimation methods for the multinomial regression model to investigate factors influencing childhood malnutrition in Kenya. Using data from the 2022 Kenya Demographic and Health Survey (KDHS), the research applies Newton-Raphson, Fisher’s Scoring, and Reweighted Least Squares methods to estimate parameters of the model and assess their classification performance. The study evaluates classification accuracy, goodness of fit, computational time, and predictive power of each method to identify the most reliable approach for modeling multinomial outcomes of childhood malnutrition, including stunting, wasting, underweight, and overweight. The methodological novelty of this study is the systematic comparison of iterative estimation methods, and the practical implications of selecting a method consistent with study objectives. By revealing causal relationships between malnutrition outcomes and significant demographic, socioeconomic, and environmental factors, the study aims to improve the analysis of multinomial datasets, provide accurate estimates, and support evidence-based decision-making for public health interventions in Kenya. The study results therefore, demonstrate practical policy implications for interventions toward high-risk children, prioritizing resource allocation and ensuring stronger credibility of evidence that supports nutritional policy decisions.
},
 year = {2025}
}
Copy
|
Download
-
TY  - JOUR
T1  - Application of Newton Raphson, Fisher’s Scoring, and Reweighted Least Squares Methods for Multinomial Regression in Investigating Childhood Malnutrition in Kenya

AU  - Paul Mwangi Kariuki
AU  - James Mwangi Kahiri
Y1  - 2025/09/26
PY  - 2025
N1  - https://doi.org/10.11648/j.ajtas.20251405.11
DO  - 10.11648/j.ajtas.20251405.11
T2  - American Journal of Theoretical and Applied Statistics
JF  - American Journal of Theoretical and Applied Statistics
JO  - American Journal of Theoretical and Applied Statistics
SP  - 203
EP  - 210
PB  - Science Publishing Group
SN  - 2326-9006
UR  - https://doi.org/10.11648/j.ajtas.20251405.11
AB  - The study of causality in multivariate relationships in scientific studies involves the application of stochastic models in quantifying complex relationships. Stochastic models are becoming increasingly significant in health research due to their adaptability in practical situations and their ability to capture randomness, assess uncertainty, and inform decision-making. The models also provide reliable performance in capturing the complex determinants of malnutrition, demonstrating prediction precision and explanatory power. This study applies iterative parameter estimation methods for the multinomial regression model to investigate factors influencing childhood malnutrition in Kenya. Using data from the 2022 Kenya Demographic and Health Survey (KDHS), the research applies Newton-Raphson, Fisher’s Scoring, and Reweighted Least Squares methods to estimate parameters of the model and assess their classification performance. The study evaluates classification accuracy, goodness of fit, computational time, and predictive power of each method to identify the most reliable approach for modeling multinomial outcomes of childhood malnutrition, including stunting, wasting, underweight, and overweight. The methodological novelty of this study is the systematic comparison of iterative estimation methods, and the practical implications of selecting a method consistent with study objectives. By revealing causal relationships between malnutrition outcomes and significant demographic, socioeconomic, and environmental factors, the study aims to improve the analysis of multinomial datasets, provide accurate estimates, and support evidence-based decision-making for public health interventions in Kenya. The study results therefore, demonstrate practical policy implications for interventions toward high-risk children, prioritizing resource allocation and ensuring stronger credibility of evidence that supports nutritional policy decisions.

VL  - 14
IS  - 5
ER  -
Copy
|
Download